





ATM Field Technician Productivity in Practice

A service manager usually sees the problem before it appears in a dashboard. One technician is covering too much geography, another is stuck waiting on a part, and a third closes a ticket that reopens 48 hours later. That is what ATM field technician productivity looks like in real operations – not just labor utilization, but the combined effect of dispatch logic, parts availability, diagnostics quality, travel patterns, and first-time fix performance.
For ATM fleets, productivity is easy to oversimplify. Many organizations still reduce it to calls per day or average time on site. Those metrics matter, but they can also hide the actual condition of the field operation. A technician who clears six low-complexity tickets in dense urban territory is not directly comparable to one handling three recycler faults across a wide rural route. Productivity only becomes useful when it is tied to fleet mix, distance, skill requirements, and service outcome.
What ATM field technician productivity actually measures
In the ATM service environment, productivity is best understood as output per field hour that results in a durable return to service. That definition sounds obvious, but it changes how teams evaluate performance. It shifts the focus away from simple activity counts and toward a combination of time efficiency, repair quality, and operational recovery.
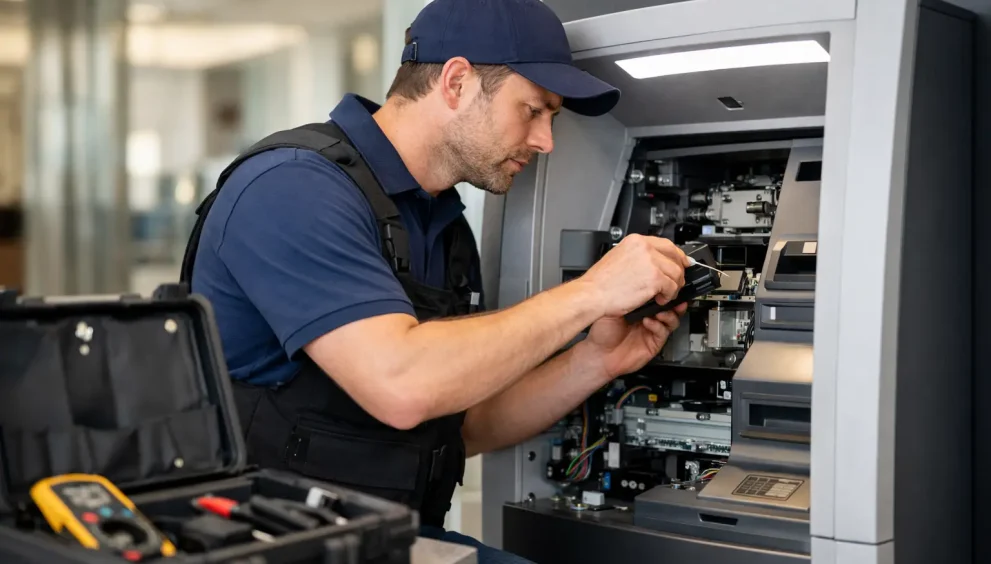
A productive technician is not just busy. That technician arrives with the right information, has access to the likely part, completes the work safely, restores the terminal correctly, and avoids a preventable repeat visit. If any of those pieces break down, the apparent productivity gain disappears elsewhere in the operation – usually as higher dispatch volume, longer downtime, or more back-office effort.
This is why mature service organizations increasingly look at technician productivity together with first-time fix rate, mean time to repair, repeat incident frequency, route efficiency, and part consumption patterns. No single number tells the whole story.
The biggest operational constraints on ATM field technician productivity
Most productivity losses in ATM service do not start with technician effort. They start upstream.
Poor ticket quality creates wasted field time
If the original incident lacks usable fault detail, the technician begins the job half-blind. A vague “terminal down” call could mean a communications failure, a card reader issue, a dispenser jam, a power problem, or an application lockup. When dispatch notes are thin, remote triage is limited, and event data is not attached, the field visit becomes exploratory. That adds time on site and increases the odds of a second visit.
This is especially costly on mixed fleets where older terminals, new deposit devices, and recycler units produce different fault signatures and service paths. Better ticket quality does not eliminate complexity, but it prevents technicians from spending valuable time establishing facts that should have been known before arrival.
Parts logistics often matter more than technician speed
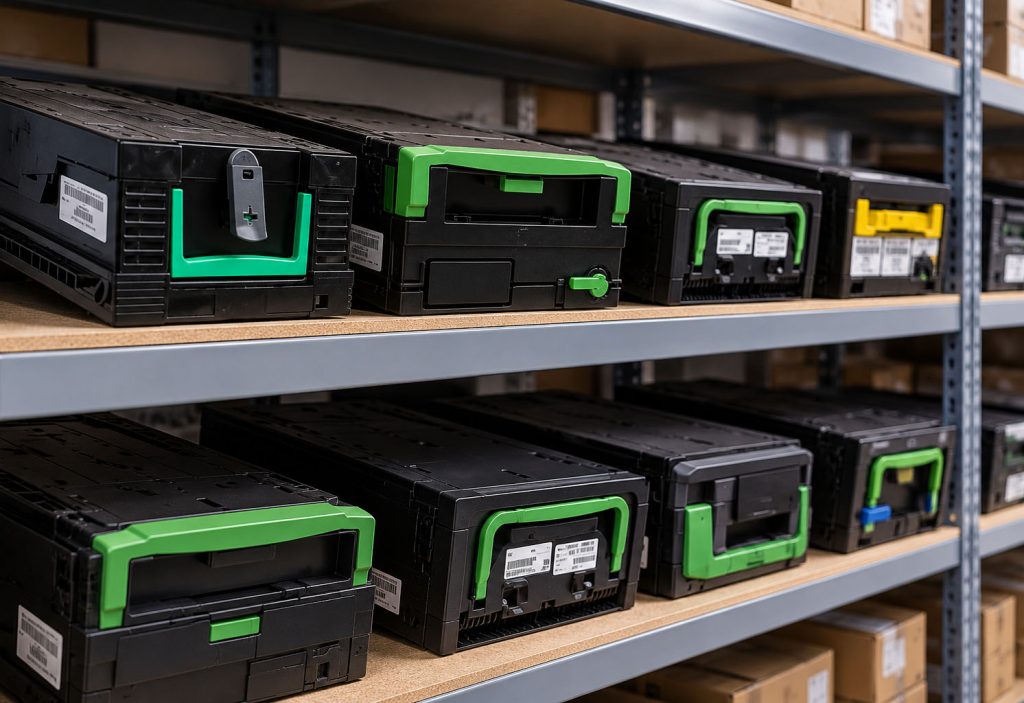
A highly capable technician still loses productivity if the required FRU is not available. Field organizations sometimes focus on labor metrics while underestimating the impact of trunk stock design, depot positioning, parts forecasting, and return processing. If the technician must leave site to source a component or defer the repair entirely, the productivity problem is not field execution. It is service supply chain design.
There is also a trade-off. Carrying too much stock increases cost and can create shrinkage or obsolete inventory exposure. Carrying too little raises repeat visits and extends downtime. The right balance depends on fleet age, terminal diversity, failure patterns, and geography.
Dispatch models can help or hurt
Centralized dispatch can improve control and consistency, but only if it accounts for local realities. Sending the nearest available technician is not always the best decision. Skill match, security requirements, parts probability, customer SLA tier, and traffic conditions often matter just as much as distance.
An over-optimized dispatch model can look efficient on paper while creating fragmented routes, avoidable windshield time, and underused specialist skills. Productivity improves when dispatch systems reflect how ATM service actually works, not how generic field service software assumes it works.
Why first-time fix rate is the anchor metric
If one measure deserves more weight than most, it is first-time fix rate. High atm field technician productivity is difficult to sustain when repeat calls remain elevated.
Repeat dispatches affect more than labor. They increase customer frustration, consume call center and coordination resources, disrupt route plans, and distort performance reporting. They also create a false sense of field activity. A team can appear highly active while spending a meaningful share of its time correcting incomplete prior repairs.
That said, first-time fix should not be treated as a blunt performance weapon. Some failures are intermittent, some terminals have layered faults, and some issues emerge only after a component is replaced and the machine returns to full transactional load. A fair measurement model distinguishes between avoidable repeat incidents and genuine multi-factor failures.
Diagnostics and remote visibility are now productivity tools
The more complex ATM estates become, the harder it is to separate technician productivity from diagnostic maturity. Better remote visibility does not replace field labor, but it makes field labor more targeted.
Remote event monitoring, device-level health indicators, and structured fault histories allow dispatch teams to classify calls more accurately before they become truck rolls. In some cases, they eliminate the visit altogether by enabling remote restart, software recovery, or configuration correction. In other cases, they allow the technician to arrive with a stronger hypothesis and the correct part.
This matters even more as fleets include newer self-service technologies with more software dependencies, peripheral interactions, and network touchpoints. Productivity gains increasingly come from reducing unnecessary travel and shortening diagnosis time, not just from asking technicians to move faster on site.
Training still matters, but targeted training matters more
Training is often discussed as a generic answer to service underperformance. In practice, its value depends on precision.
A broad training push may improve baseline competence, but the strongest productivity gains usually come from targeted intervention. If repeat incidents cluster around deposit modules, recycler calibration, software image recovery, or encrypted communications setup, those are the areas to address. Generic refreshers are easier to schedule, but they do not always solve the highest-cost failure modes.
There is also a structural issue in the labor market. Many service organizations are managing a mix of veteran technicians with deep electromechanical knowledge and newer staff entering a more software-defined service environment. Productivity programs work better when they support both groups. Experienced technicians may need sharper tooling around digital diagnostics and workflow systems, while newer technicians often need more depth in failure isolation and component behavior.
Geography changes the math
A technician in a dense metro territory and one serving a rural banking footprint live in different operating models. Comparing them through the same productivity lens creates bad incentives.
In urban areas, route density can support more calls per day, but parking constraints, site access delays, and branch traffic can slow actual repair windows. In rural territories, travel dominates the day, so first-time fix and part readiness matter even more. A single failed visit may consume hours that cannot be recovered elsewhere.
That is why service leaders should normalize productivity expectations by territory type, machine concentration, and fleet complexity. Otherwise, the metrics punish geography rather than reveal performance.
Where automation helps and where it does not
Workflow automation can improve technician productivity when it removes coordination friction. Automatic ticket enrichment, smarter scheduling recommendations, digital checklists, and mobile parts visibility all support faster execution.
But automation has limits. It does not solve weak field processes, poor data discipline, or inconsistent service standards. If the underlying incident coding is unreliable or the parts catalog is poorly maintained, the software simply accelerates flawed decisions. The better approach is to treat automation as a multiplier of operational quality, not a substitute for it.
A better way to manage productivity
The most credible productivity programs combine a small set of field metrics with regular operational review. Calls per day, travel time, first-time fix, repeat incidents, and parts fill rate usually provide a stronger picture together than any one of them alone. When those measures are reviewed against machine type, territory, and service class, managers can start identifying whether the problem is skill, planning, inventory, diagnostics, or workload design.
That multi-factor view also produces better technician management. If one person has lower output because they are repeatedly assigned the hardest calls or the widest geography, the answer is not necessarily performance correction. It may be route redesign, specialist assignment changes, or better pre-dispatch triage.
The field operation tends to improve when technicians are treated as the last step in a service chain, not the sole variable responsible for outcomes. Most sustained gains in productivity come from reducing uncertainty before the truck roll and removing friction around the repair.
For ATM operators, banks, and service providers, that is the more useful question to ask: not how to make technicians busier, but how to make each field hour count for more.